
NOTE:
This document has been abbreviated from its original form for the purposes of a Grand Challenge Scholars portfolio
Introduction
This design document will describe the process of designing and building a marine hydrokinetic generator. It includes information on the hardware and mechanical components, software, user interface, test plan, alternative designs, context, engineering standards, milestones, and approved budget. The goal of this project is to generate electricity through the prototype using primarily ocean/wave energy. The project will serve as a functional device that converts wave energy into electricity on a small scale. The impact of the project is providing an improved understanding of renewable energy generation and engineering design processes.
Overview
Climate change and rising global temperatures have been an ongoing problem due to the extensive use of burning fossil fuels to produce energy and electricity, which can be dated back to the late 1800s. Modern renewable energy sources can help relieve some of society’s energy dependence on fossil fuels. The purpose of this project is to research, design, and build a hydrokinetic energy generator that utilizes the waves of the ocean to produce electricity.
The first step of this project was to research various methods of hydrokinetic energy generation that would be feasible to build. After thorough research of each method and weighing the pros and cons, the team decided to build an oscillating water column. Located on the shore of a moving body of water, a hollow column is partially submerged underwater, which houses an air turbine placed inside of the column. When a wave flows through the device, it fills part of the hollow chamber. This pressurizes the air inside the column beneath the turbine, which forces the air through the turbine, ultimately generating usable electricity. When the wave’s trough passes through the column, it voids the chamber and creates a vacuum that pulls the air back down through the turbine, forcing the turbine to spin again. As shown in Figure 1, the hydrokinetic generator essentially uses water as a piston to drive air through a bi-directional turbine. Using a bidirectional impulse design, the turbine will spin in the same direction regardless of whether the air is traveling up or down through the column. The next step was to build and test the generator, completing the project by the end of the year. As a proof of concept, the oscillating water column will charge an iPhone to demonstrate that 5 watts of electricity is being generated. Figure 2 shows a block diagram of how each component interacts with one another.
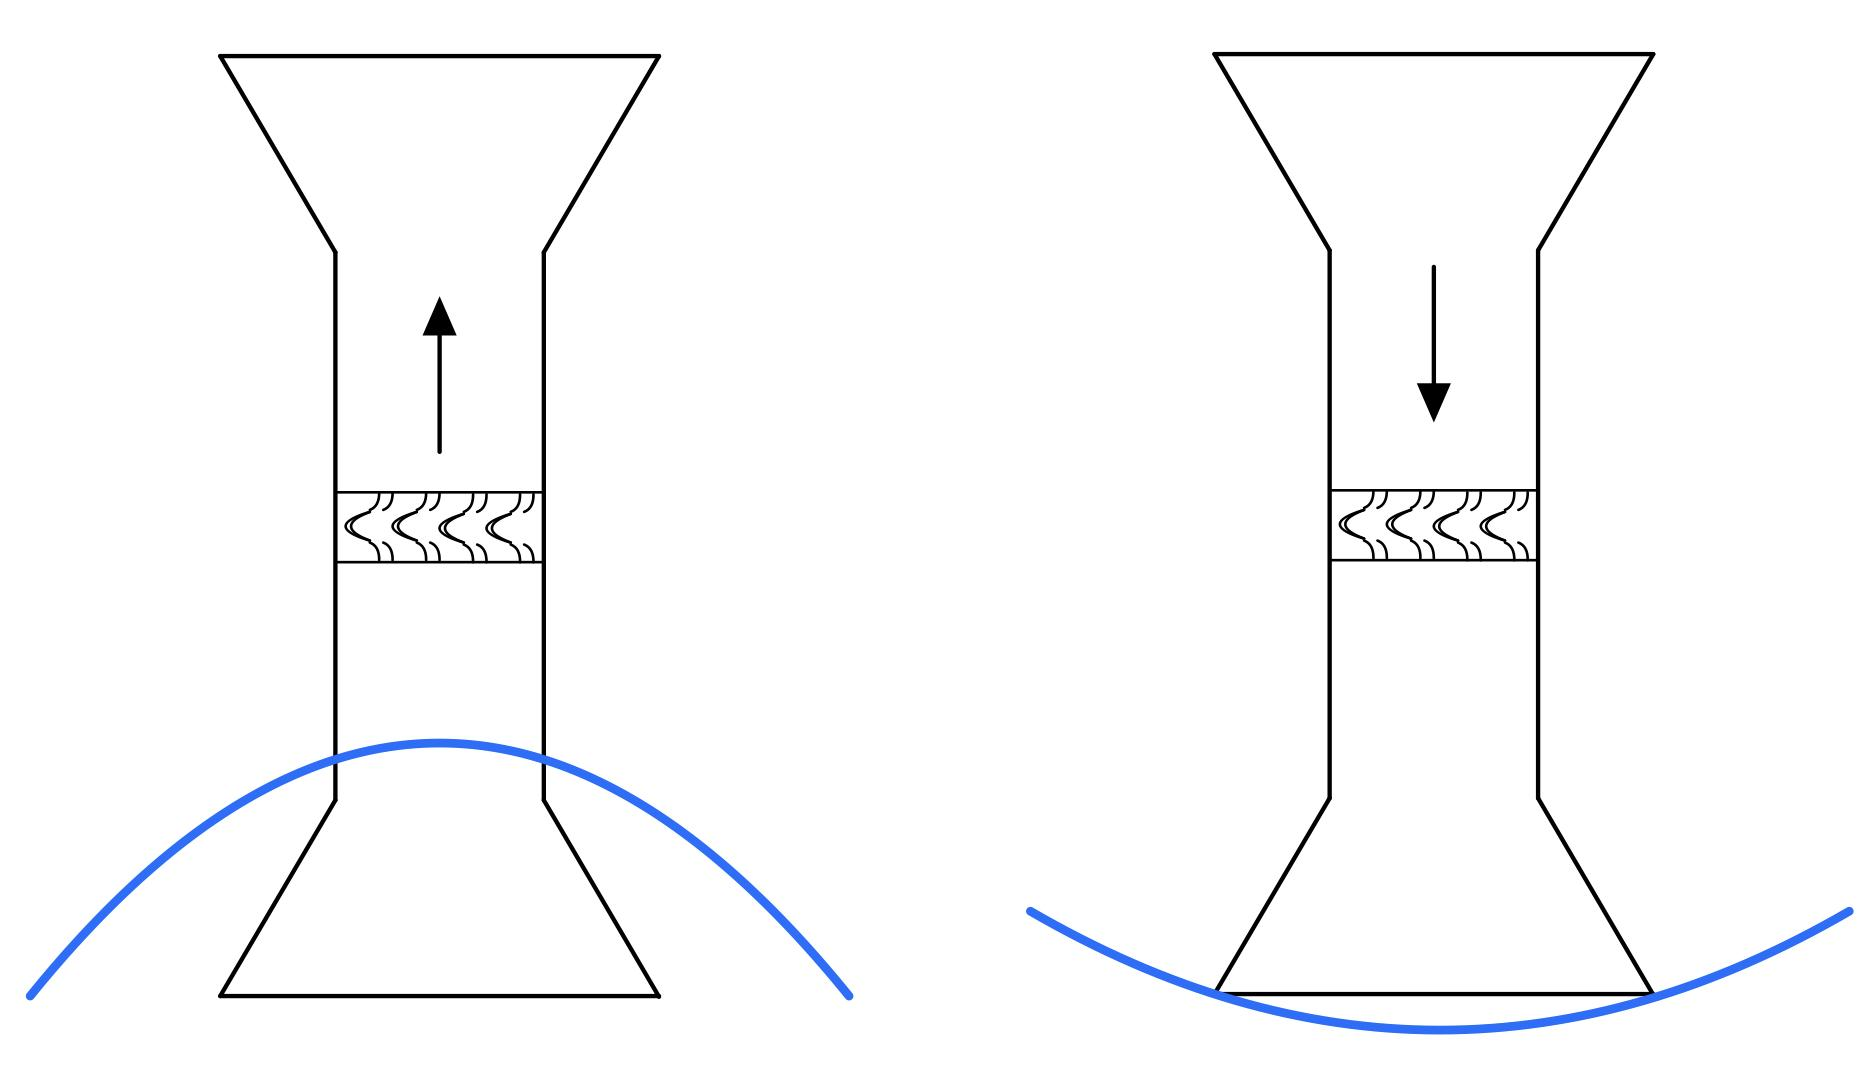
Figure 1: Oscillating Water Column (OWC) Schematic
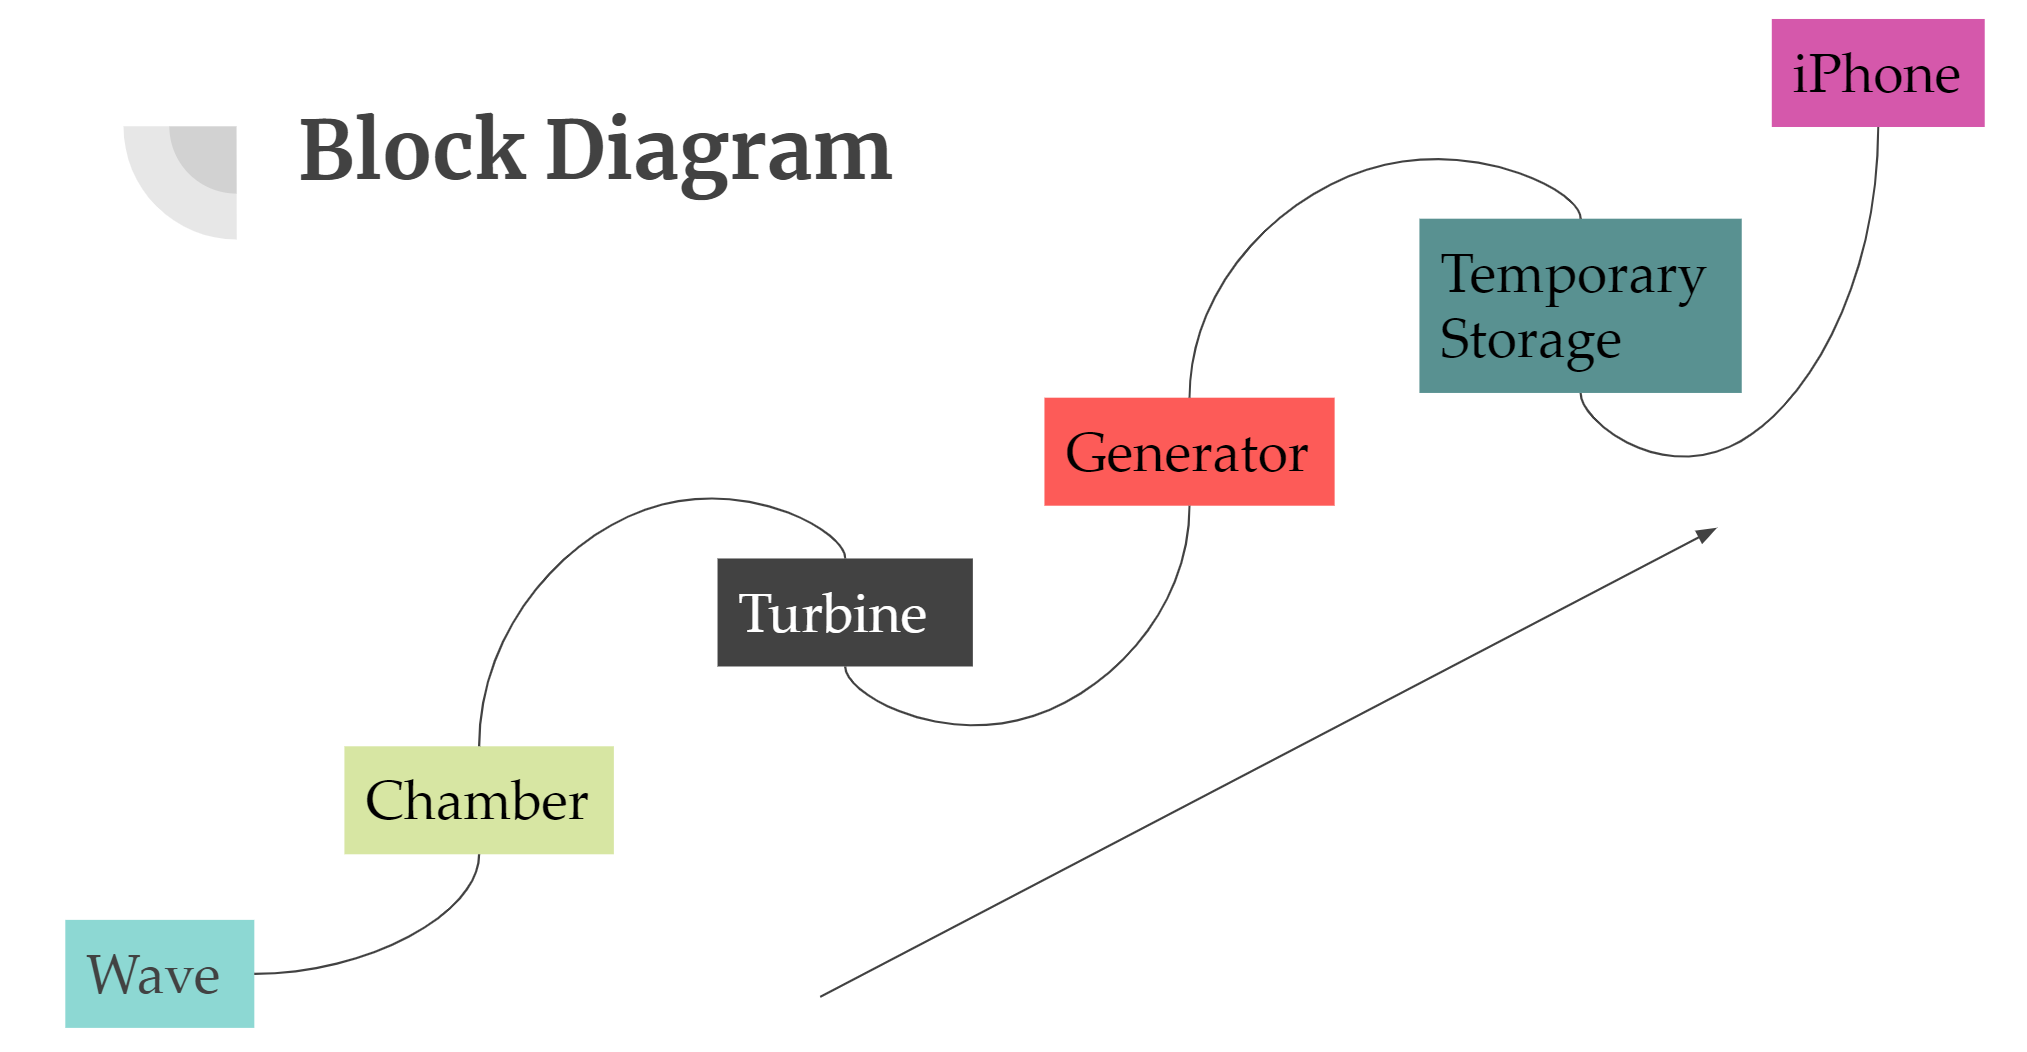
Figure 2: Block Diagram of Prototype
Hardware/Mechanical Components
The main housing of the design is a buoy that will be anchored to the seafloor in such a way that the bottom of the buoy is placed at the trough of predictable waves. The buoy will contain the chamber that holds the turbine and generator. The wave will fill and void the bottom section of the chamber, fluctuating the air back and forth through the turbine. At the center of the chamber, there is a bidirectional impulse turbine preceded on both the top and bottom by guide vanes. The guide vanes help direct the flow of air perpendicular to the turbine blades. These components can be seen in the second and third subassemblies of Figure 3.
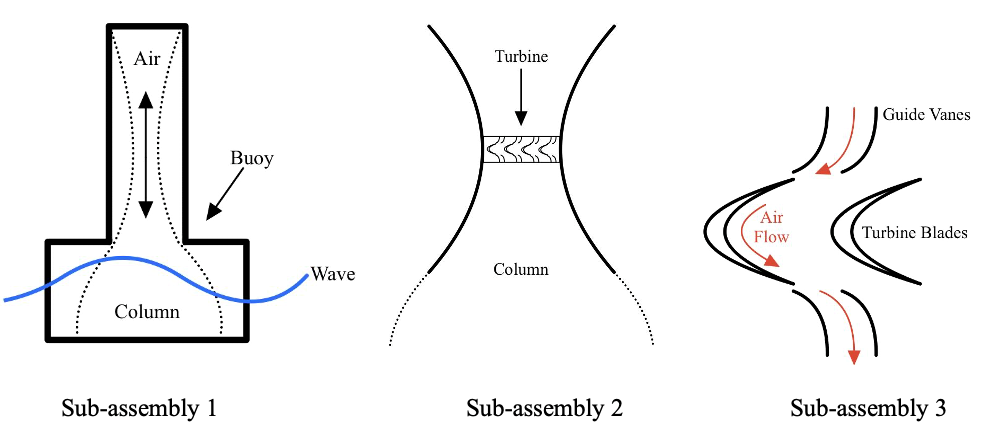
Figure 3: Sub-assemblies of Mechanical Components
Attached to the turbine shaft is a generator, which will be mounted to the buoy. The rotation of the generator shaft will induce an electrical current which will be directed by a positive and negative lead to a circuit, consisting of a rectifier and a buck/boost device, as shown in Figure 4. The rectifier will take the AC voltage output from the generator and convert it to a DC voltage, which will then flow through a buck/boost converter that can either magnify or reduce the input voltage to a specified output voltage to be delivered to the iPhone for charging.
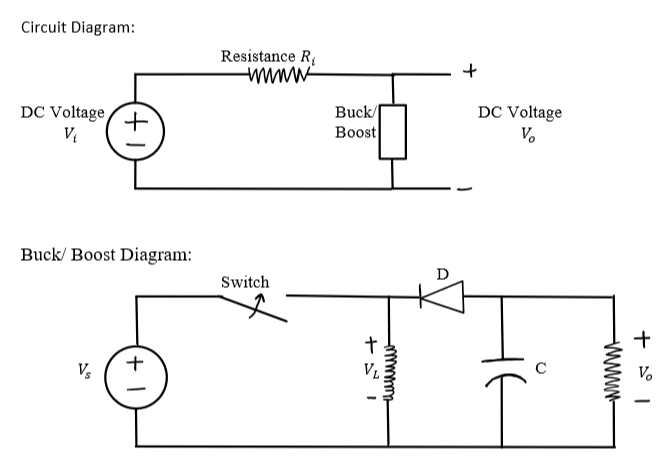
Figure 4: Basic Circuit Diagram for Generator
Test Plan Results
The following section outlines the methods and results of the test procedures. The discussion will be broken up into three distinct sections each isolating a unique aspect of the design: 25% scale bidirectional impulse turbine (BIT) RPM values, venturi chamber pressure impulse response, and generator performance.
25% Scaled Turbine RPM Testing:
An anemometer and multiple hairdryers were used to determine the RPM of the first turbine prototype (which was scaled down to 25% of the original size to save time) given various air velocities. Only four data points could be collected due to a limited ability to obtain controlled air velocities. At airspeeds less than 4 m/s, the turbine would not spin. At airspeeds higher than 7 m/s, the turbine spun too fast to be recorded by the slow-motion cameras which made RPM calculations impossible. Therefore, 4 m/s to 7 m/s were the bounds of RPM vs airspeed testing. Between these bounds, only two more airspeeds (5.1 m/s and 6 m/s) could be reliably reproduced and tested. Figure 5 charts the RPM data with a trendline.
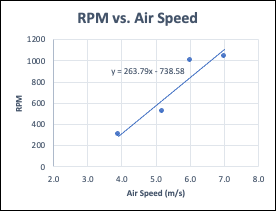
Figure 5: Turbine RPM Test Results
Venturi Chamber Pressure Impulse Response:
The purpose of testing the venturi chamber was to gain insight into possible positive pressure increases on the leading side of the turbine when waves pass over the device. To simulate the transmission of a wave, the bottom of the venturi was submerged in a bucket of water in a measured time frame. The time of submersion and height of the water was measured as the frequency and amplitude of the simulated wave. A schematic of the digital components of the test set up including the pressure transducer and DAQ is shown in Figure 6. A macro schematic of the setup can be seen in Figure 7 After an initial round of testing, it was determined that the positive pressure increase created in the chamber was smaller than the precision capable of the pressure transducer and ultimately could not be considered reliable.
To increase the positive pressure-gain in the chamber and acquire usable data, the team simulated the resistance that would have been created by having the turbine in the chamber. This was achieved by choking the top of the chamber using a piece of cardboard with a small hole in the center. The size of the center hole was determined by replicating the solidity of the turbine.
The results of the venturi chamber testing took the form of a pressure impulse response. The average maximum positive pressure in the chamber was .086psi, and the average duration of the impulse was three seconds. A graph displaying the data can be seen in Figure 8. Unfortunately, the team failed to leave enough time for this data to heavily influence the design of the final prototype, but it is extremely valuable in a qualitative sense, offering insight into the kinds of waves that will be able to generate power using the current design.
It is important in any technical discussion to highlight possible sources of error in data. In the case of this data collection, the limited number of trials and human input drastically increase the variability from trial to trial. To mitigate this each trial was recorded in slow motion and the force input for each impulse was recorded. Given the chance to repeat these tests, the number of trials would be increased, and a force sensor would be attached to the side of the venturi to accurately measure the force input of each trial.
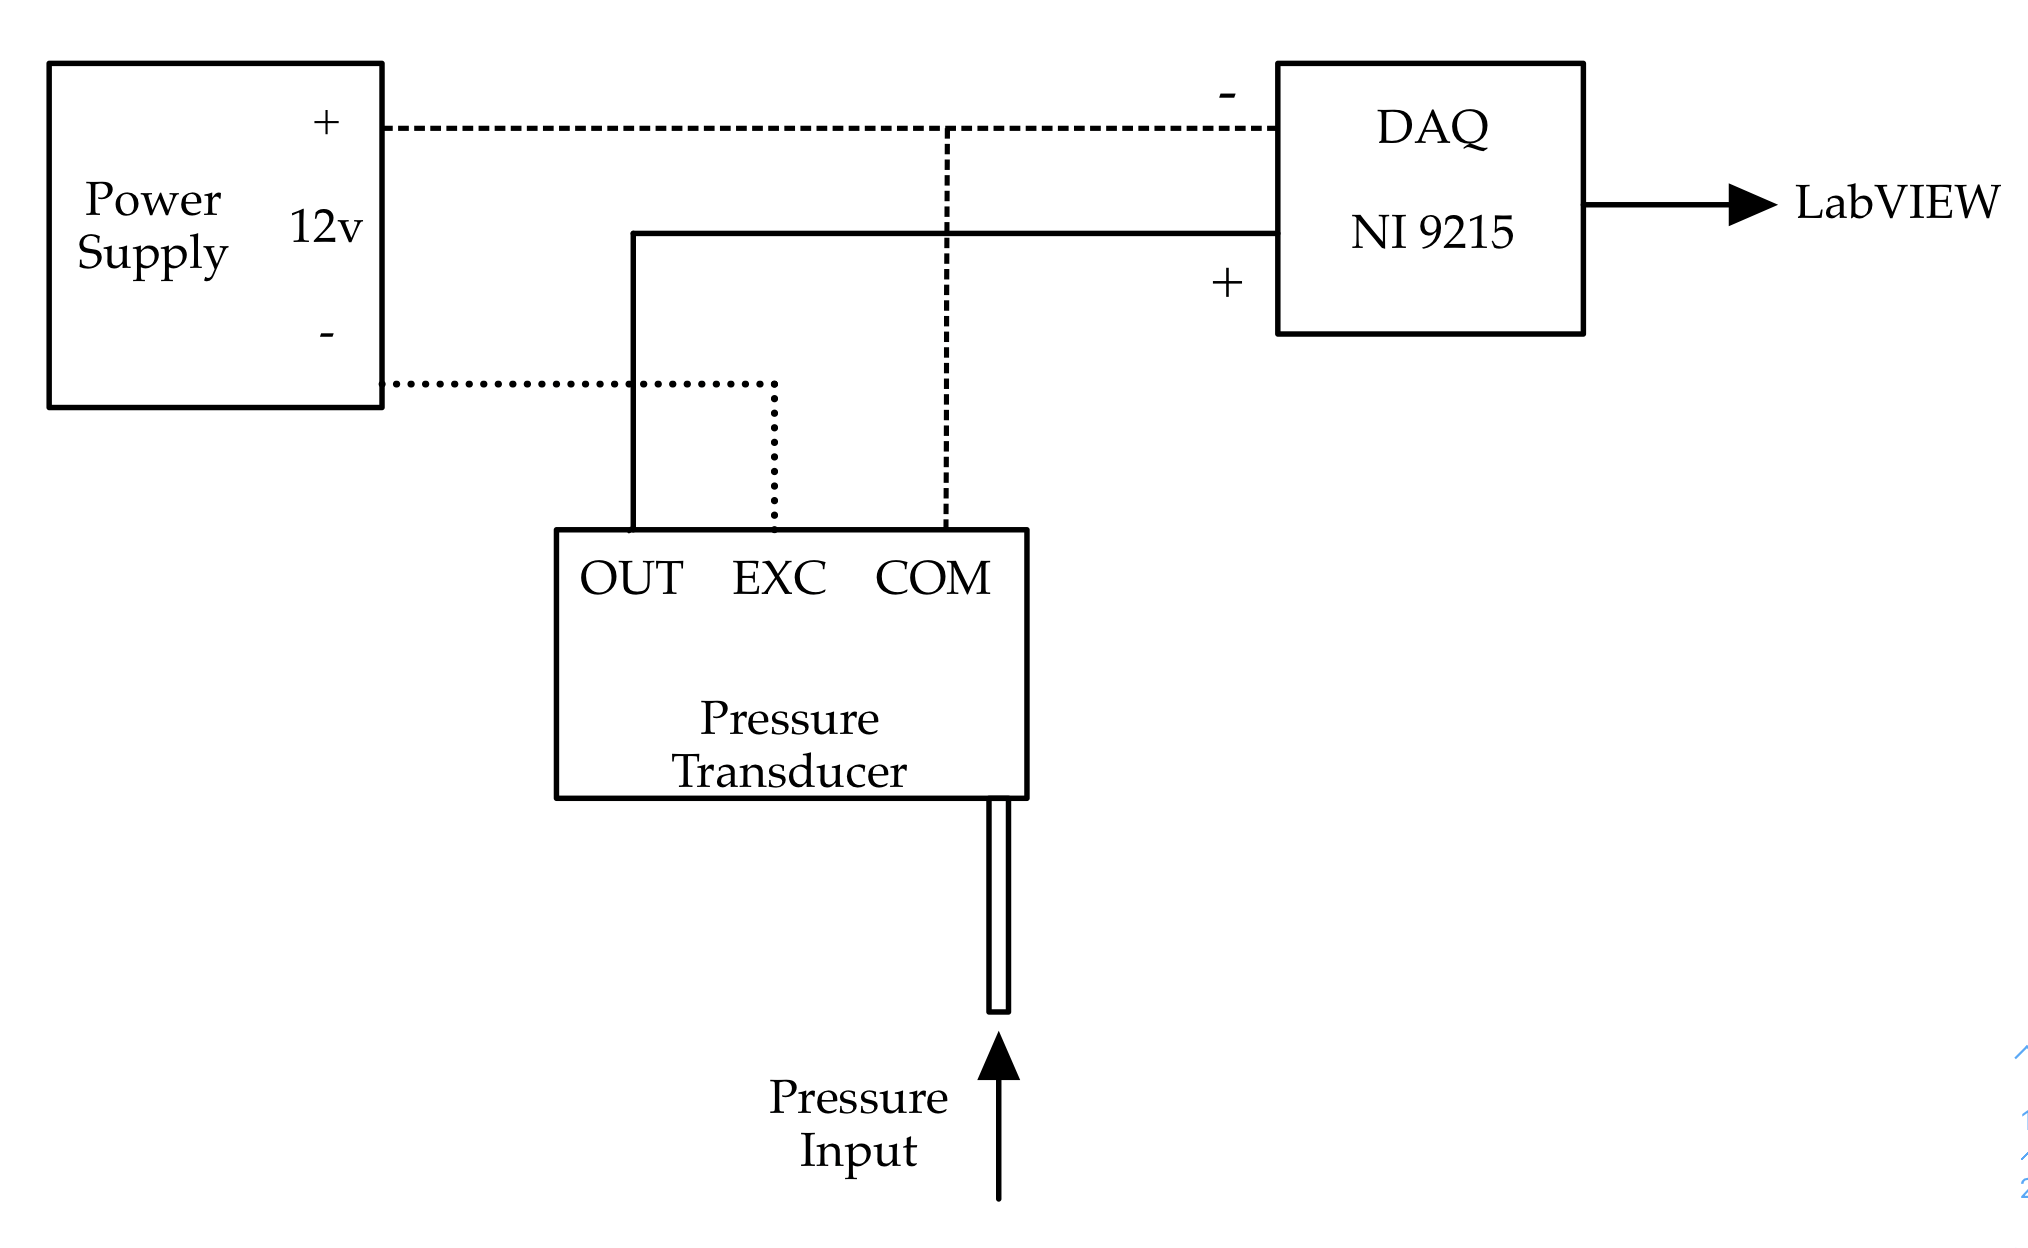
Figure 6: Pressure Transducer and Labview Schematic
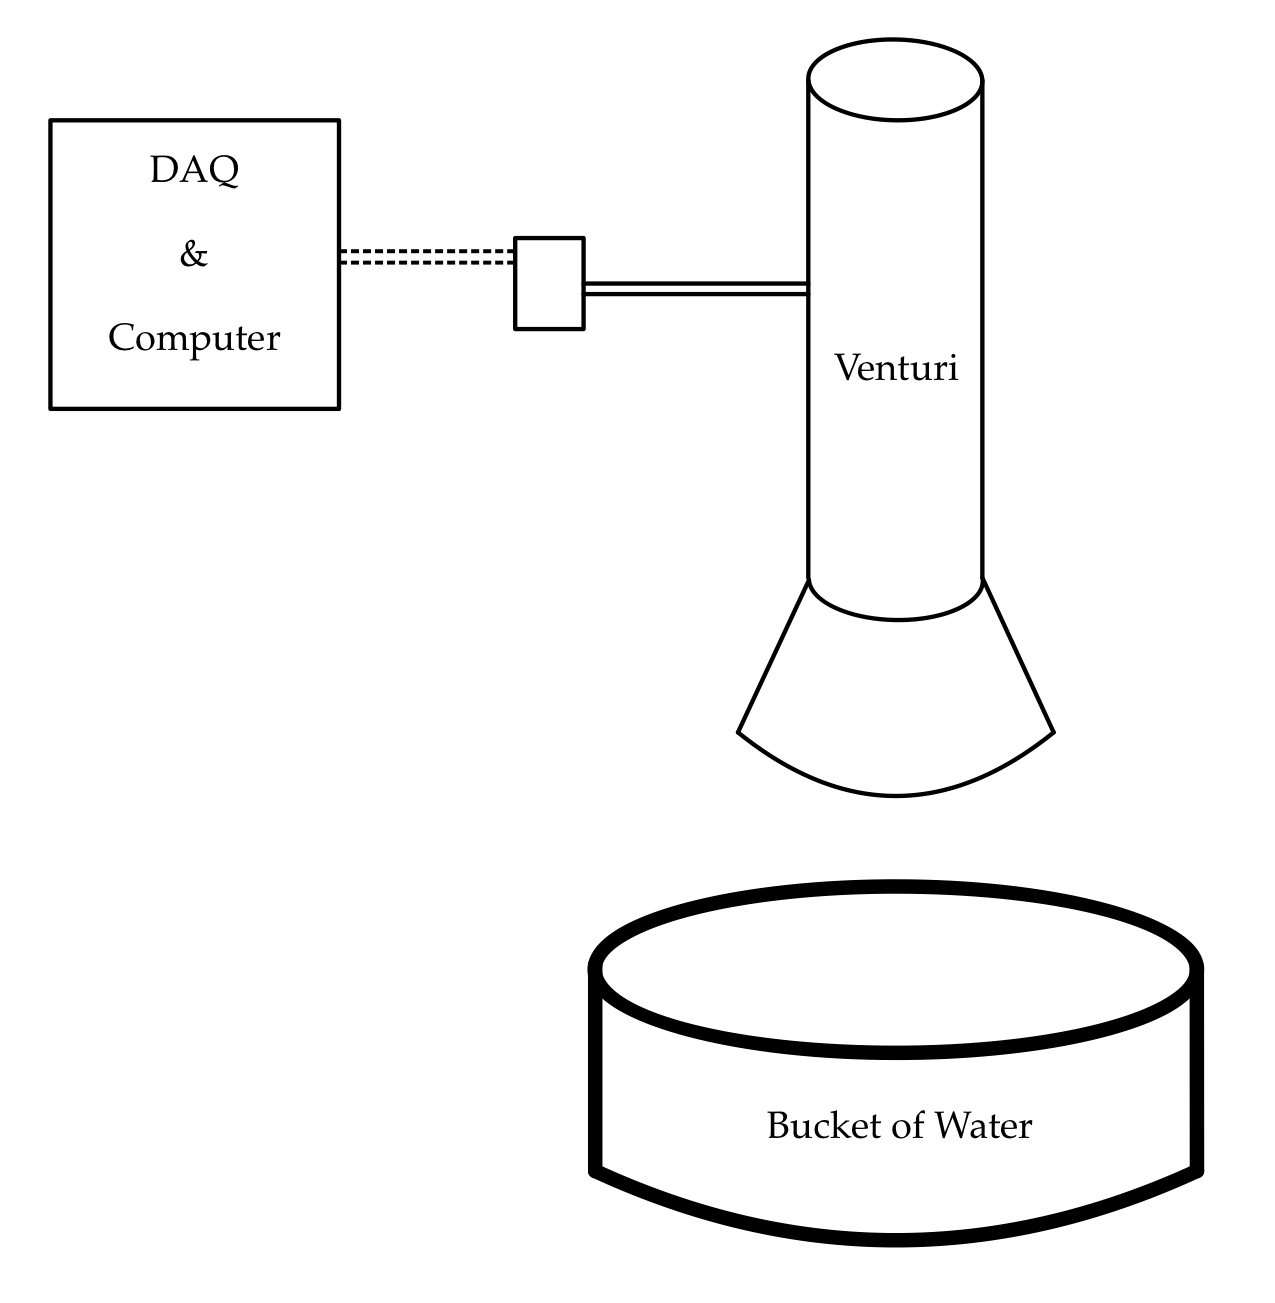
Figure 7: Macro Hardware Test Setup
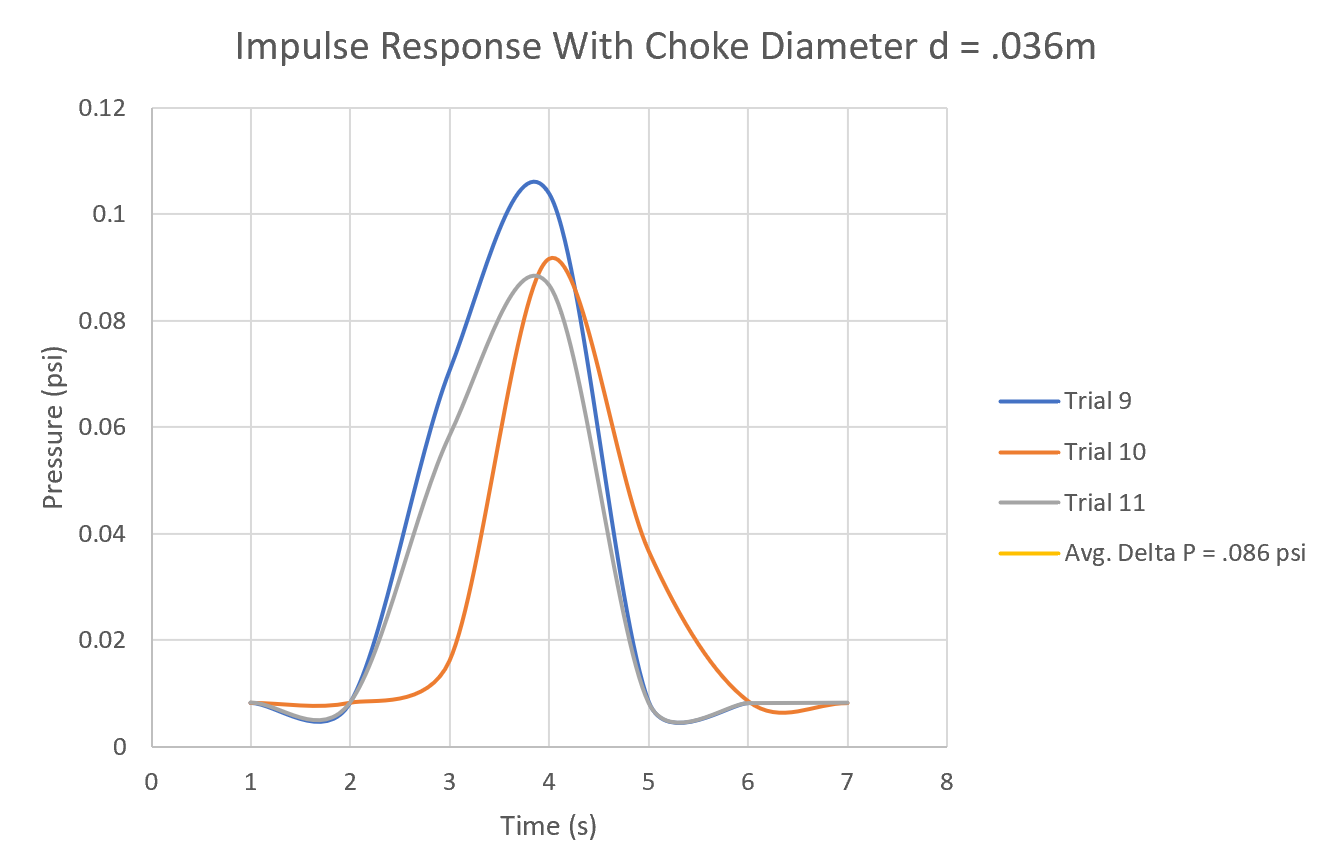
Figure 8: Impulse Response
Data Analysis on Venturi Testing Data
The time of submersion and height data from the venturi chamber testing was analyzed in MATLAB to approximate the frequency range of waves that would best fit the design. The trial data were trimmed to mimic an individual Gaussian Pulse and pasted into an Excel spreadsheet. A sinusoidal approximation was created to simulate the data points. The data were graphed in the time domain and then converted to the frequency domain where the frequency response could be determined. Based on the frequency domain graphs in Figure 9 and Figure 10, the ideal range mimics that of a low-pass filter where efficiency falls at 60 Hz then again at 120 Hz, before leveling off.
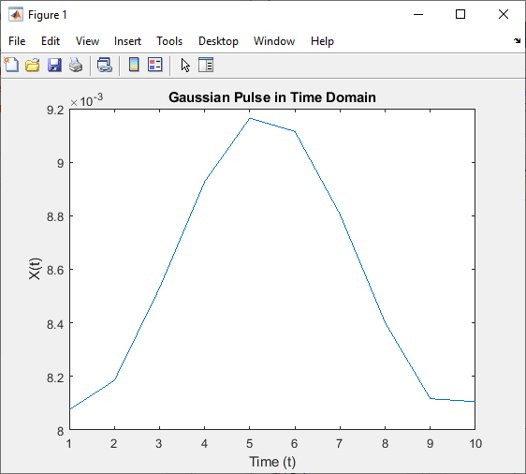
Figure 9: Gaussian Pulse (Frequency Domain)
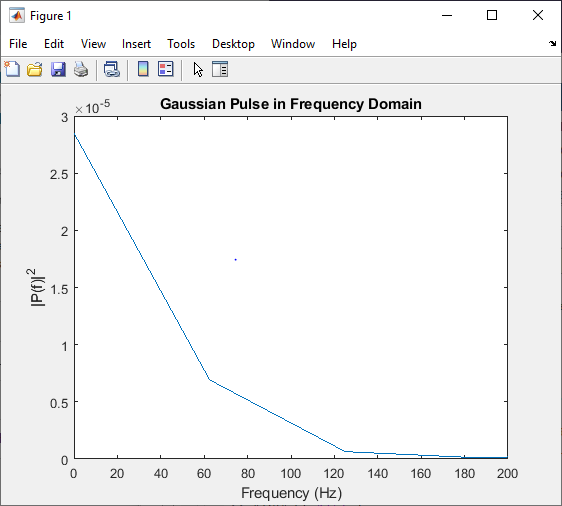
Figure 10: Gaussian Pulse (Frequency Domain)
Generator/Circuit Testing
Circuit testing was conducted to ensure that each component behaved as expected. Isolated testing was done on the generator and USB converter before comprehensive testing was done with the complete circuit.
The generator was tested for two characteristics. First, the generator shaft was connected to a drill press with a controllable RPM output, then the generator’s power output was found at various rotational speeds. Voltage and current output values were collected corresponding to rotations per minute of the shaft. This testing was controlled by attaching the shaft to a drill press displaying the RPMs. A DMM was attached to the generator leads to take voltage and current measurements. The measurements of power were entered into an excel spreadsheet, along with the inputted rotations-per-minute values to graph the correlation between the two values.
The USB converter was isolated and tested by powering it with DC Power Supply and taking voltage and current measurements to the output; this data can be seen in Figure 11. The testing was done using a 10-ohm resistor as a load. The result of this test was a minimum power input of 13mW needed to activate the USB converter to output a standard 5V.
The last stage of circuit testing was conducted by connecting the shaft of the generator to a second motor powered via a DC power supply. This powered the generator and the circuit. Voltage and current measurements were taken at strategic points in the circuit to find the power needed to activate the USB converter with a 200-ohm load as a substitute for a charging iPhone. Then the resistor was replaced by an iPhone to confirm that it enters the charging stage.
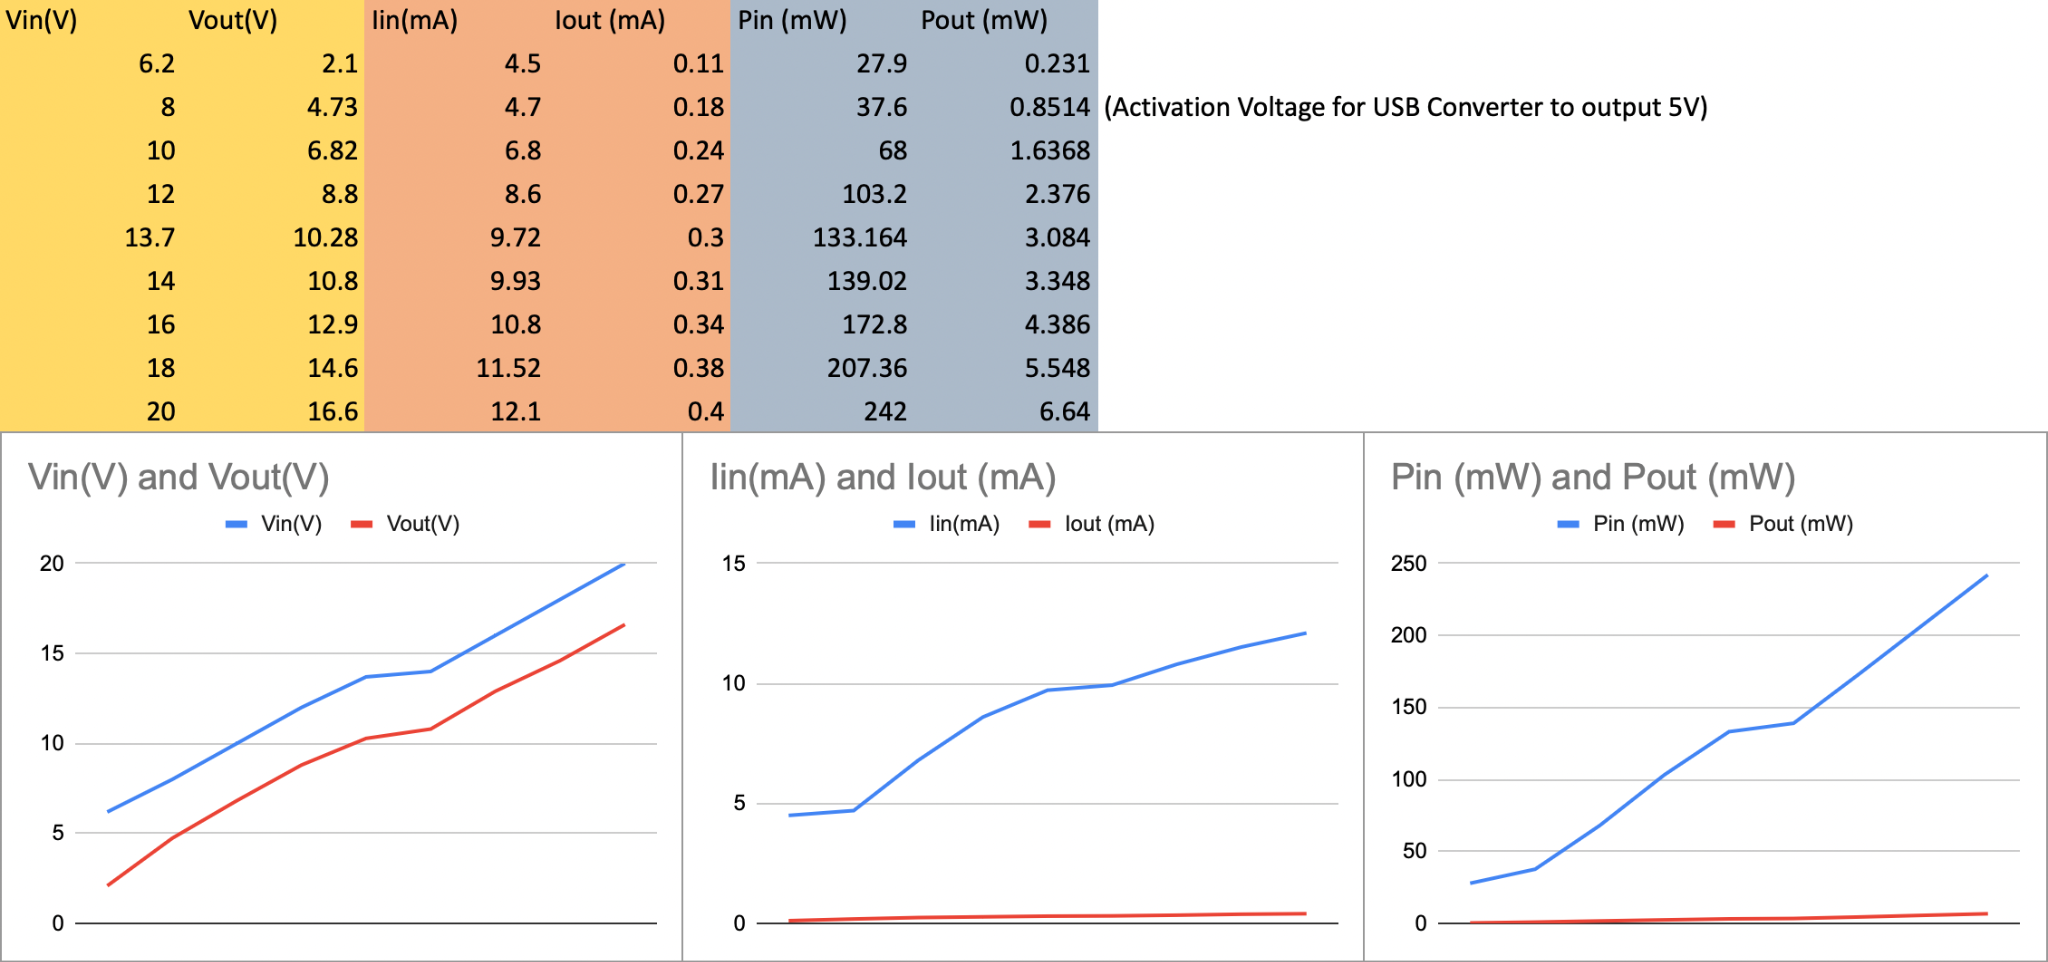
Figure 11: Circuit Power Output Testing Results
Final Build
For the final build of the project the PVC pipe was cut in half and the bidirectional impulse turbine (BIT) was placed in between the two pieces with rubber bands around the inner fitting of the BIT to act as gaskets. Dog cones, acting as ventures, as well as the BIT were all secured to the PVC pipes. An LED that indicates rotation of the turbine, and therefore creation of power, was constructed on a PCB circuit board and attached to the outside of the generator. Most of the exterior components were fastened together with duct tape. An image of the BIT can be found in Figure 12. And an image of the final build can be found in Figure 13.
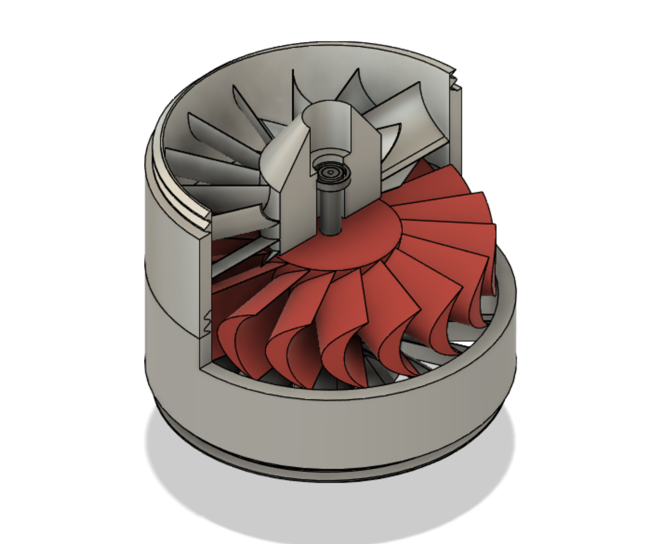
Figure 12: Bidirectional Impulse Turbine Assembly
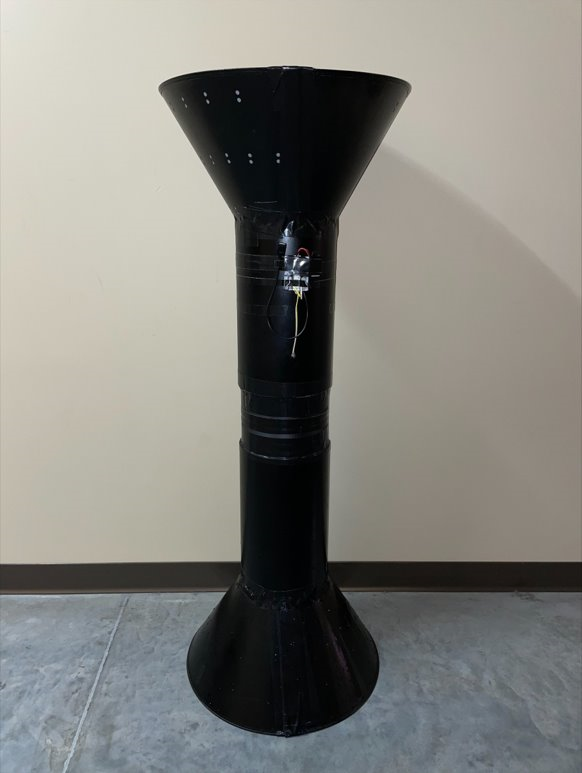
Figure 13: Final Build of the Oscillating Water Column
Limited testing of the final build was achieved. The first test of the final design was done in the surf at Seaside OR. In waist-deep water, the generator was manually oscillated up and down at a frequency of nearly 1Hz. Using this test method an average voltage of approximately 3 volts was achieved. The second test of the build was completed in the Shiley Hall fluids lab, on the University of Portland campus. The same methodology for gaining the pressure-time response of the first venturi build was repeated. For this test, the LED was excited using one manual displacement of the generator in the same large container of water used earlier in the project. This activation of the LED indicates that while refinement is needed for practical implementation, the underlying physical phenomena present in the motion of the generator are valid for energy creation.
Alternative Designs
The team considered other forms of hydrokinetic marine generators such as overtopping wave energy converters, attenuators, and tidal turbines. The oscillating wave converter was chosen over the alternatives, in part, due to the given project timeline, budget, and location. Notable advantages of the oscillating water column are that it isolates the waves from the electrical components, eliminating the need to waterproof wires and connections. Also, the oscillating water column is easily scalable in terms of size and power output.
Context
The biggest factor considered in the design of the marine hydrokinetic generator (MHK) is and was the environmental implications. Wave energy, by nature, is a form of renewable energy. However, even MHKs can have negative environmental impacts. For example, an overtopping wave energy converter (OWEC) captures water when waves flow over a concave platform, then directs the water back into the ocean through a turbine. OWECs can have negative effects on ecosystems since they “capture” water, and send it through a turbine, which could harm wildlife caught in the flow. Furthermore, OWECs have electrical components that are submerged in water, which requires waterproofing and adds risk to local wildlife.
The biggest obstacle for wave energy generators is that they currently are not as economically feasible as other energy sources. This is partly because other renewable energy sources, such as wind and solar, are more practical because they aren’t limited to operating offshore. Moreso, the MHK industry is small in comparison to the wind and solar industries, so the amount of research and development put into wave generators is relatively low. However, with the decreasing dependency on fossil fuels, there is a high probability of future advancement of MHKs. By creating a budget before the development of this product, the team aims to create a wave generator in the most frugal way possible. To have the biggest economic payout, the team tested the product to maximize future efficiency, while carefully selecting the materials and components that are incorporated in the design.
Lastly, the wave generator should not cause any risk of harm to people. One of the many reasons for transitioning to a more renewable energy grid is to minimize the potential health hazards to human life. By carefully selecting construction materials, the team aims to minimize the use of potentially harmful materials such as Polyurethane (a common waterproofing material that is also a respiratory toxin) and plastics (which lead to microplastics).
Lessons Learned
The nature of this capstone project means there is nothing this team hasn’t done for this project without learning it beforehand. There were simply too many new concepts retained about research, design, testing, and teamwork for them to all be included in this report in a meaningful way. The most important lesson during this year-long project is that learning requires failure, and failure takes time. Every single aspect of this project has led the team to something new and unexpected. Each one of these discoveries was never accounted for in the initial planning and therefore takes time to understand and find remedies and solutions. While the team is extremely proud of its accomplishments and the work that has been put into this project, more time would result in further refinement of the oscillating water column.
Conclusion
The goal of this project was to design and build a marine hydrokinetic energy generator. This report shows the process and steps it took to build the generator. Ultimately the project was successful. Using simulated means, the generator serves as a functional device that converts wave energy into electricity on a small scale. This project will increase the exposure of wave energy, as well as push the envelope forward for other engineers passionate about the health of the planet, and renewable energy sources. There are existing commercially available products with the same goal as this device, intended for ocean wave energy capture. The difference between this device and others like it is that this project was a synthesis of existing technologies, such as venturis and bidirectional turbines. As new design are tried and tested, the marine hydrokinetic generation industry draws one step closer to marketable energy production.
Bibliography
[1] Elizaldo dos Santos, Oscillating Water Column Device. 2021 [Online]. Available: https://www.researchgate.net/figure/Oscillating-Water-Column-Device_fig1_280134885. [Accessed: 23- Sep- 2021]
[2] "compass", Compass.astm.org, 2021. [Online]. Available: https://compass.astm.org/document/?contentCode=ASTM%7CD1141-98R21%7Cen-US. [Accessed: 24- Sep- 2021]
[3] "Corrosion in Seawater", ASM Handbooks Online, 2021. [Online]. Available: https://dl.asminternational.org/handbooks/book/26/chapter/353581/Corrosion-in-Seawater. [Accessed: 23- Sep- 2021]
[4]"IEEE 2030.3-2016 - IEEE Standard Test Procedures for Electric Energy Storage Equipment and Systems for Electric Power Systems Applications", Standards.ieee.org, 2021. [Online]. Available: https://standards.ieee.org/standard/2030_3-2016.html. [Accessed: 23- Sep- 2021]
[5]"compass", Compass.astm.org, 2021. [Online]. Available: https://compass.astm.org/document/?contentCode=ASTM%7CD5385_D5385M-20%7Cen-US. [Accessed: 30- Sep- 2021]
[6] R. Zingel, "Grid Compliance Conditioning of Renewable Power Sources by Means of Modern Power Electronics," 2007 European Conference on Power Electronics and Applications, 2007, pp. 1-8, doi: 10.1109/EPE.2007.4417788.
University of Portland
5000 N. Willamette Blvd.,
Portland, Oregon 97203-5798
503.943.8000